#diagnose system top 5 10. Use this command to display: • up time (Run Time) • current total processor and memory usage • current free memory • a list of the top most resource-intense currently running system processes and daemons, with respect to their memory (RAM) and processor (CPU) usage The first two lines of the display indicate the up time, and the processor and memory usage. Processor and memory usages on the second line have abbreviated labels, highlighted below in bold. Run Time: 0 days, 21 hours and 3 minutes 0U, 4S, 95I; 1035792T, 646920F Table 10: Abbreviations for processor and memory usage Letter Description U User CPU usage (%) S System CPU usage (%) I Idle CPU usage (%) T Total memory (KB) F Free memory (KB) The remaining lines contain the process list, which has the following columns. Table 11: Process list columns Column 1 ...
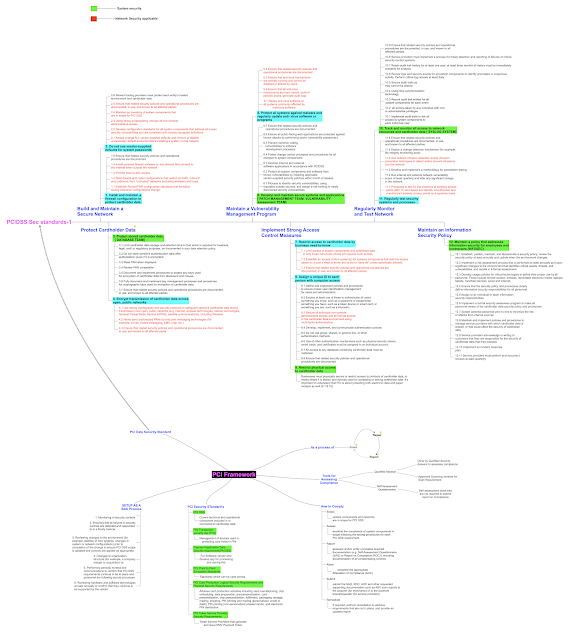
I loved the way you organized your points and how you explained PCI DSS Framework through Mindmap. It is so easy to understand. Thank you for taking the time to write that article! Read More on SD-WAN and How Banking & Financial sector uses SDWAN and Cyber Hygiene for Startups
ReplyDeleteThanks
ReplyDelete